通过Python生成随机纤维 RVE 模型并导入到ABAQUS中进行分析
RVE
An RVE can be defined as the smallest volume of the material which remains representative of the bulk/effective properties of the material.
Concept
The initial concept for random fibre RVE model creation is to generate the fibre centroid randomly within the specific range, which is the dimension of RVE model. If the cubic RVE model is required, the sum of side value of RVE model and fibre radius is the boundary for fibre centroid location.
However, it is obviously that the randomly fibre centroid generation method cannot bring us a high fibre volume fraction. In my test, it can be used for generating RVE model with fibre volume fraction of 39%.
对于这个文章,有39% 的纤维含量的RVE 模型已经足够了,因为这只是个讲解。我目前的RVE 模型生成器可以大概达到55% 的纤维模量。其实对于我的复合材料项目,这个模型已经够了。如果想要生成更高纤维含量的RVE 模型,可以阅读以下几篇文献,相信它们能够提供一些灵感。不过有些文献中的纤维坐标生成方法好像违背了“随机”的初衷。
RVE 模型大小
对于RVE 模型的大小,这里使用的是50倍的纤维半径来作为RVE 的模型大小。我忘记是哪一篇文献中提到的要使用50倍这个数值了。但是实际上,我们选取RVE 模型的大小还是要根据RVE 的定义来。它不能过大以至于增加模拟的负担,也不能过小丧失代表性。在以下要讲解的这个例子中,我们还是以50倍为标准吧。
纤维生成规则
在RVE 模型中,纤维的生成还是要保证一些规则的。
It is obviously that we cannot generate overlap fibres within the RVE model. Therefore, the distance between each fibre is doubled fibre radius at least.
The fibre cannot be created outside of RVE model.
If the fibre generated at the one side of RVE model, a corresponding fibre should be created at the opposite side to make the periodic properties.
Python建模
首先要导入一些必要的库 numpy 和 matplotlib肯定是必不可少的。
1 | import numpy as np |
纤维中心距离判定
这里我规定了两个纤维最小距离(distance)为2 * fibre radius + 0.1。
1 | def distance_determine(self, r, x, y, x_data, y_data): |
RVE 模型可视化
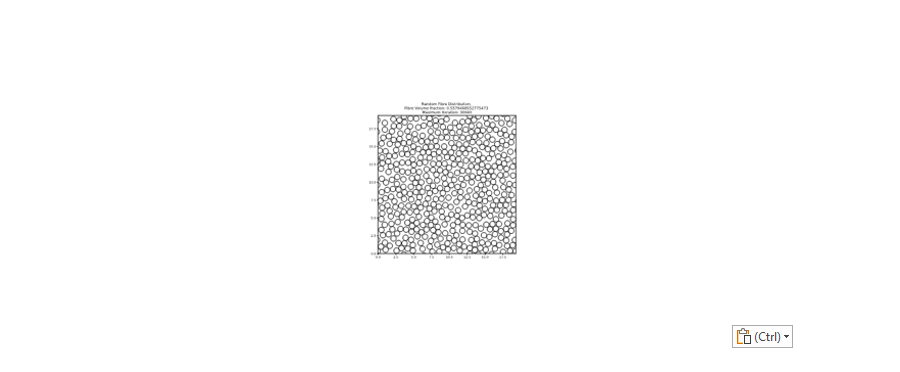
We need to consider visualizing the RVE model using Python. Although we implemented a very solid rule for generating fibres within the RVE model, it is worthwhile to visualize the distribution of fibres by Python before constructing RVE model in the ABAQUS. 在导入到 ABAQUS 建立模型之前,我们要考虑一下如何把 RVE 模型可视化出来进行初步检验。
最重要的部分是如何在matplotlib中生成一个圆来代表纤维。Matplotlib好像没有直接建立圆形的工具,但是可以间接的建立。通过matplotlib建立两个半圆弧,然后合并在一起就是一个圆了。下面的代码需要传入的数据包含纤维的大小,纤维原点 x, y 的坐标信息,还有两个变量用于更直观的展示当前RVE模型的纤维含量和生成此RVE模型的迭代次数。
1 | def display(self, r, x_c, y_c, vf_current, Max_iteration): |
此代码一次只能展示一个纤维,所以我们在Fibre_generation 这个function中生成了多少个纤维,就会调用这个function多少次。
Fibres 信息输出
我们还需要把纤维的坐标信息分别输出到.txt文件中,当然也可以输出到同一个文件,为了之后对生成的纤维的横纵坐标做数据分析,这里我生成了两个文件分别包含了纤维中心点的横纵坐标:
1 | def output_txt(self, x, y, data_name_x, data_name_y): |


